
































Login
Register
Top Leagues
Country
We use cookies to ensure that we give you the best experience on our website.

Over 2.5 goals landed in 53% of Big Five league matches last season. That is not an insight. It is a coin with juice on it.
Double Chance favourites landed 79% of the time and still lost money. Correct-score favourites landed 10% of the time and lost a lot of money. The gap between those two sentences is the whole point of looking at “accuracy” properly.
This is original eScored research based on 1,752 finished Big Five league matches and stored pre-match odds. It is not a ranking of predictors and it is not a 90% win-rate brochure. It measures what popular betting markets actually did—and whether their prices already knew.
The sample is domestic league football only: 15 August 2025 to 24 May 2026. Where odds exist, the favourite is the shortest stored pre-match price — for Over/Under 2.5 that is Over or Under, not always Over — with the overround stripped out of the implied probability. ROI is a flat 1 unit on those stored odds, except Draw No Bet (see notes). Base rates use every finished match; favourite metrics use only matches with stored odds.
A market can be “right” most of the time because the price already says it will be.
| Market | n | Popular side hit | Fair implied | Flat-stake ROI |
|---|---|---|---|---|
| 1X2 favourite | 1,281 | 53.1% | 51.8% | +1.5% |
| O/U 2.5 short side | 1,416 | 57.3% | 57.5% | −1.7% |
| BTTS favourite | 1,418 | 57.2% | 55.8% | −0.6% |
| Double Chance favourite | 1,415 | 78.7% | 78.0% | −1.5% |
| Draw No Bet favourite* | 951 | 71.4% | 69.3% | +3.1% |
| Asian handicap (main line) | 1,150 | 54.1% | 55.6% | −4.6% |
| Correct score favourite | 1,419 | 9.8% | 12.7% | −22.9% |
*DNB probabilities and equivalent odds were reconstructed from the stored 1X2 market; draws were treated as pushes (330 pushes excluded from n). That ROI is not calculated on stored DNB prices.
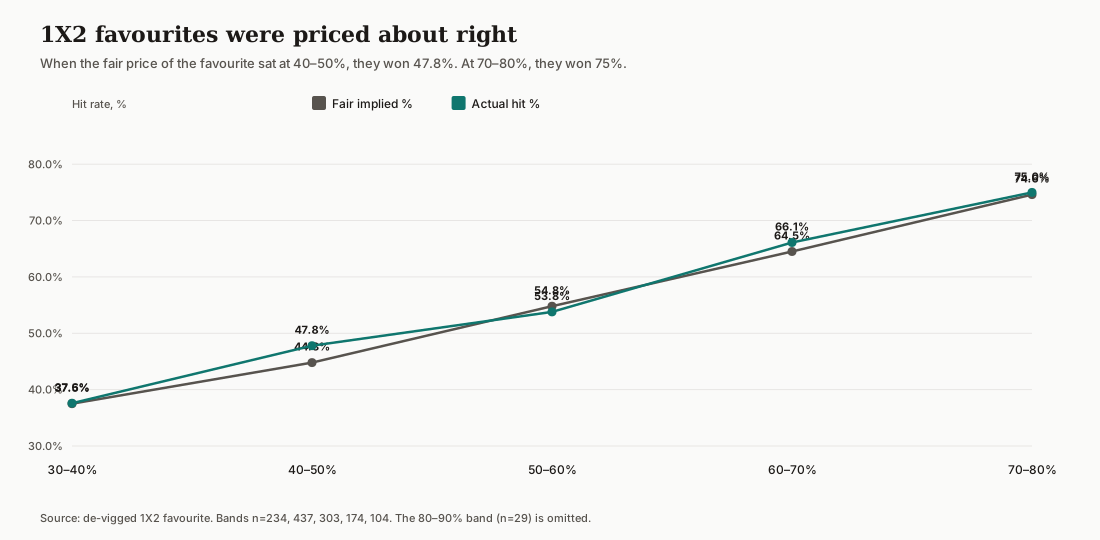
1X2, Over/Under 2.5, BTTS and Double Chance were well calibrated. The book was not asleep. You do not beat those markets by backing “the side that usually hits”.
The +1.5% ROI on 1X2 favourites is well within one-season noise and should not be treated as a betting edge. The standard error on that hit rate is about 1.4 percentage points; a 95% interval is roughly ±2.7 points.
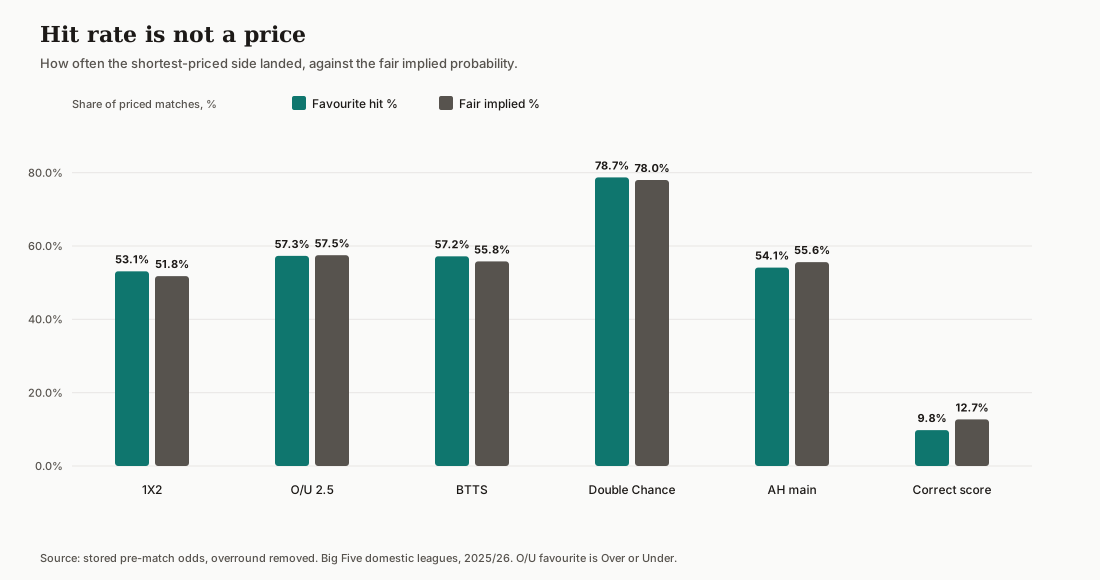
Correct score is the trap. The shortest stored score still only landed 9.8% of the time, against a 12.7% implied chance, at average odds of 8.27. That is a −23% season.
No odds required. All 1,752 games.
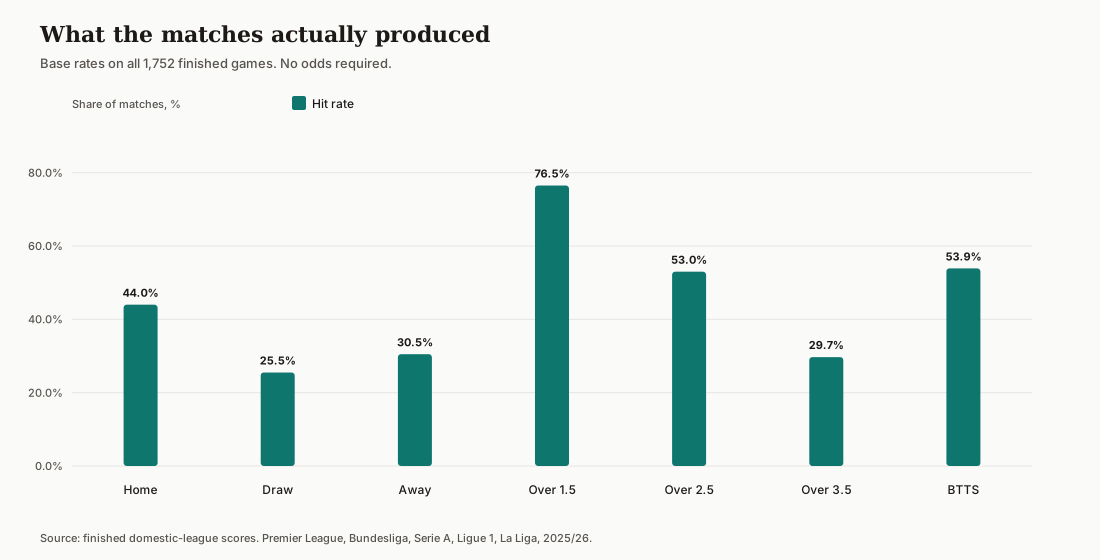
Over 1.5 is the market that looks unbeatable in a highlights reel. Three matches in four go over. Same story as Double Chance: a high hit rate is already built into a short price.
Over 2.5 is not one bet. The 2025/26 seasons are on eScored: Premier League, Bundesliga, Serie A, Ligue 1, La Liga.
| League | n | Home | Over 2.5 | Over 3.5 | BTTS |
|---|---|---|---|---|---|
| Bundesliga | 306 | 43.8% | 63.7% | 42.8% | 61.8% |
| Premier League | 380 | 42.6% | 55.0% | 28.4% | 56.1% |
| Ligue 1 | 306 | 46.1% | 52.6% | 32.7% | 50.7% |
| La Liga | 380 | 48.9% | 50.0% | 25.5% | 56.6% |
| Serie A | 380 | 38.9% | 45.8% | 22.1% | 45.3% |
Serie A last season was a different sport from the Bundesliga. Home wins were rare, both-teams-to-score was a minority outcome, and Over 2.5 missed more often than it landed.
That is a statement about the matches. It is not, by itself, a statement about the coupon.
Serie A’s shortest-priced O/U side landed only 50.8% of the time against a 56.3% fair implied probability, producing −10.6% ROI (n = 321). That short side is Over or Under. On the Over 2.5 line itself, the coupon was already close: fair implied 45.6%, actual 47.4%. The market had the low-scoring league; it was the short-priced side that was overpriced.
La Liga 1X2 favourites outperformed their prices: 54.8% hits against 50.8% implied, +6.7% ROI (n = 270). Premier League 1X2 favourites went the other way: −6.7% (48.7% vs 52.3%, n = 279). Bundesliga 1X2 favourites: +5.1% (56.1% vs 52.1%, n = 223).
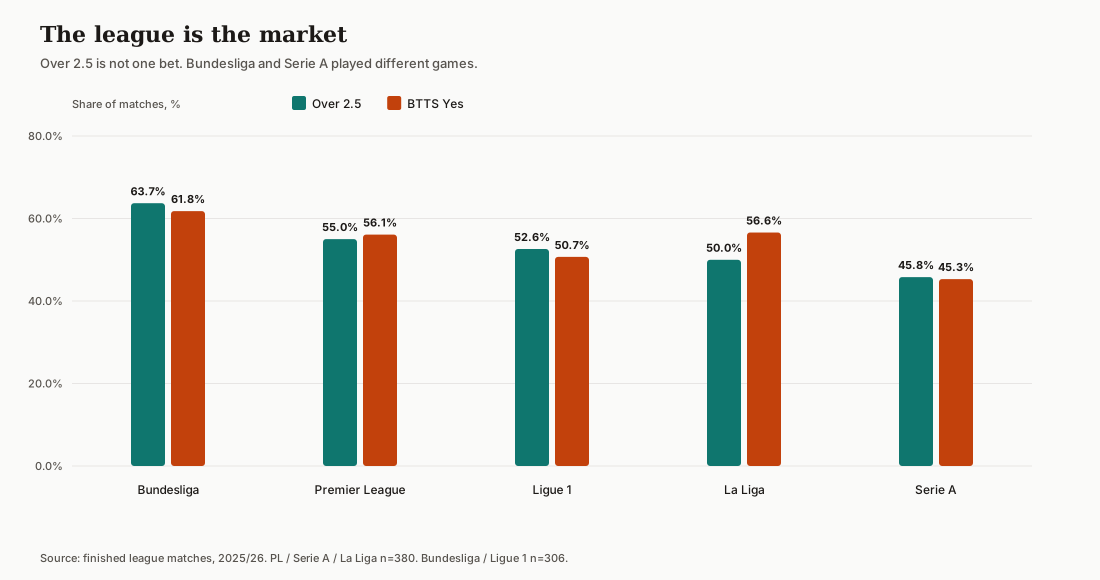
A “popular Over 2.5” tip that does not say which league it is talking about is already the wrong tip. Select the league and market before treating Over as a strategy.
If you had bet the same side every time, with no picking:
Always backing the away side was the worst blind 1X2 strategy in this sample. That does not make every away team overpriced; it shows how little information exists in the rule itself.
The most common real score was 1-1 (11.7%), then 1-0 (9.5%) and 2-1 (9.0%). The shortest stored correct-score price still landed only 9.8% of the time against a 12.7% implied chance. Average odds 8.27, ROI −22.9%. High hit-rate markets (DC, Over 1.5) look smart and pay juice. Longshot markets look exciting and pay worse juice.
| Score | Count | Share of 1,752 |
|---|---|---|
| 1-1 | 205 | 11.7% |
| 1-0 | 166 | 9.5% |
| 2-1 | 158 | 9.0% |
| 0-1 | 131 | 7.5% |
| 1-2 | 127 | 7.2% |
| 2-0 | 120 | 6.8% |
| 0-0 | 114 | 6.5% |
| 2-2 | 95 | 5.4% |
It is not a claim about eScored tip hit rates. That is a different test. This file is the market’s hit rate on Big Five league games.
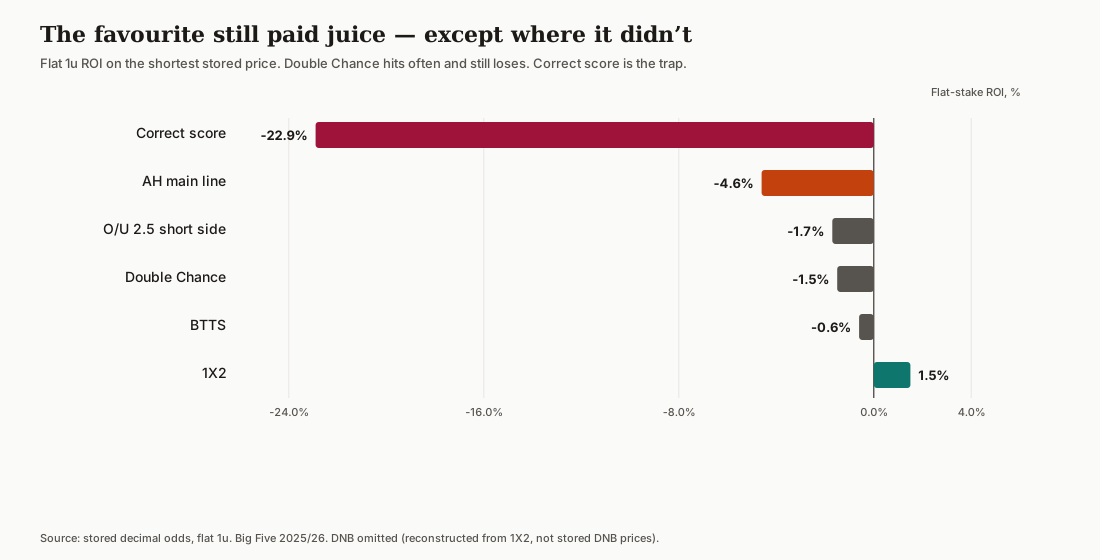
It is not proof that bookmakers “got 1X2 right and correct score wrong” in some moral sense. Odds absorb demand. Correct score is a demand-heavy market. Double Chance is a cover market. Their prices reflect not only outcome frequency, but also margin, customer demand and the type of risk bettors are willing to buy.
Bookmakers price the whole book, including margin, demand and liability; no individual favourite needs to be perfectly calibrated.
Favourite metrics are not 100% of matches: 1X2 odds were stored for 1,281 of 1,752 games. Base rates use the full set. DNB probabilities and equivalent odds were reconstructed from the stored 1X2 market; draws were treated as pushes. Asian handicap “main line” is the complementary pair closest to even money.
Method: finished domestic-league scores; stored decimal odds; fair probabilities = 1/odds with overround removed; favourite = shortest price; ROI = flat 1u on those stored odds, except reconstructed DNB as noted. Stack and definitions: About eScored.
eScored content is for information and analysis. It is not financial advice and not a prompt to gamble. Predictions do not guarantee winnings.
In the Big Five, popular markets generally landed about as often as their prices suggested. The useful conclusions were specific, not universal: Serie A produced far fewer high-scoring matches than the Bundesliga, its shortest-priced O/U sides underperformed, La Liga 1X2 favourites outperformed their prices, and the shortest-priced correct score remained an expensive way to be precise.
On eScored
The prediction engine turns expected goals into a score matrix, then into the markets in this study. Use Predictions to filter by league and market before treating Over as a default, and Daily Tips for selections where the model sees a gap versus the price. Staking is a separate problem; Kelly does not rescue a line that is already priced.
Related: How to identify overrated and underrated football teams.
Responsible Gambling Disclaimer
eScored content is provided for informational and analytical purposes only and does not constitute financial advice or encouragement to gamble. Predictions and statistics do not guarantee winnings. Betting involves the risk of financial loss and is intended only for adults of legal gambling age. You are solely responsible for your decisions and any resulting consequences. Always follow the laws of your jurisdiction and gamble responsibly.
Select matches to build your Betslip
Two or more legs are from the same match. Multiplying probabilities overstates the chance — those outcomes share one score.
Unlock joint probability