

































Login
Register
Top Leagues
Country
We use cookies to ensure that we give you the best experience on our website.

The bookmaker’s favourite is the shortest price on the coupon. eScored’s pick is the highest probability from XGBoost. Same Big Five matches. Same stored decimal odds. Flat 1u.
That is the whole test. Hit rate without a price is a brochure. A model that “hits more often” and buys worse prices can still lose. A model that hits the same and is not on the short side can still win.
This is original eScored research on the 2025/26 domestic seasons: Premier League, Bundesliga, Serie A, Ligue 1, La Liga. 1,752 finished league games. A match enters a table only when both the model book and the odds exist — Over/Under 2.5 n=1,367, BTTS 1,369, full 1X2 1,232. It is not a ranking of tipsters and not the published Best Tips in the 2026 accuracy review.
| Market | n | Favourite hit | eScored hit | Δ | Favourite ROI | eScored ROI | Agree |
|---|---|---|---|---|---|---|---|
| 1X2 | 1,232 | 53.0% | 53.2% | +0.2 | +1.5% | +10.1% | 81.0% |
| Over/Under 2.5 | 1,367 | 57.1% | 59.2% | +2.1 | −2.1% | +7.4% | 70.9% |
| BTTS | 1,369 | 57.0% | 57.1% | +0.1 | −1.1% | +4.0% | 69.8% |
| Double Chance | 1,171 | 79.8% | 80.6% | +0.8 | −0.5% | +3.1% | 66.6% |
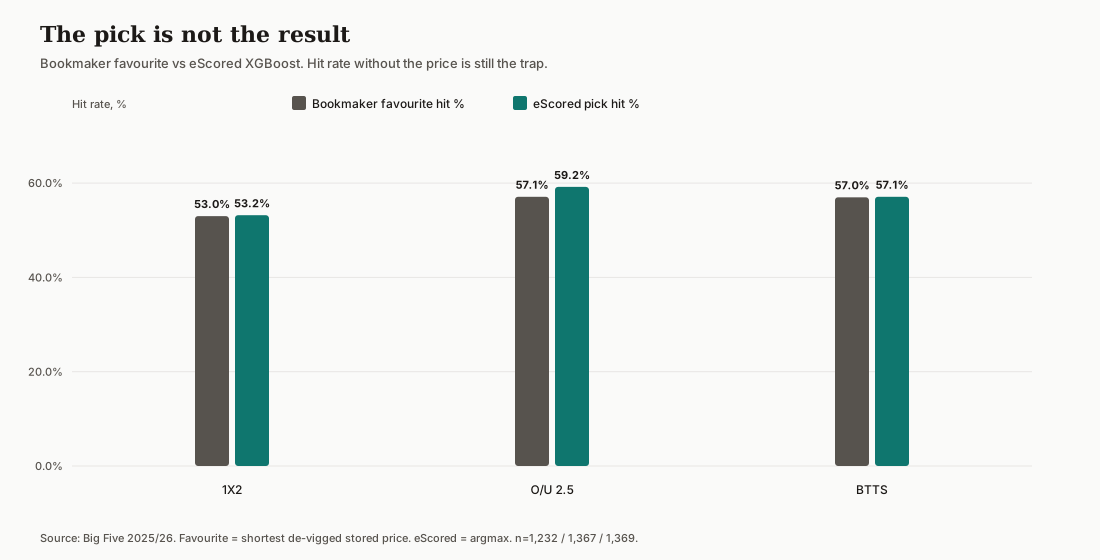
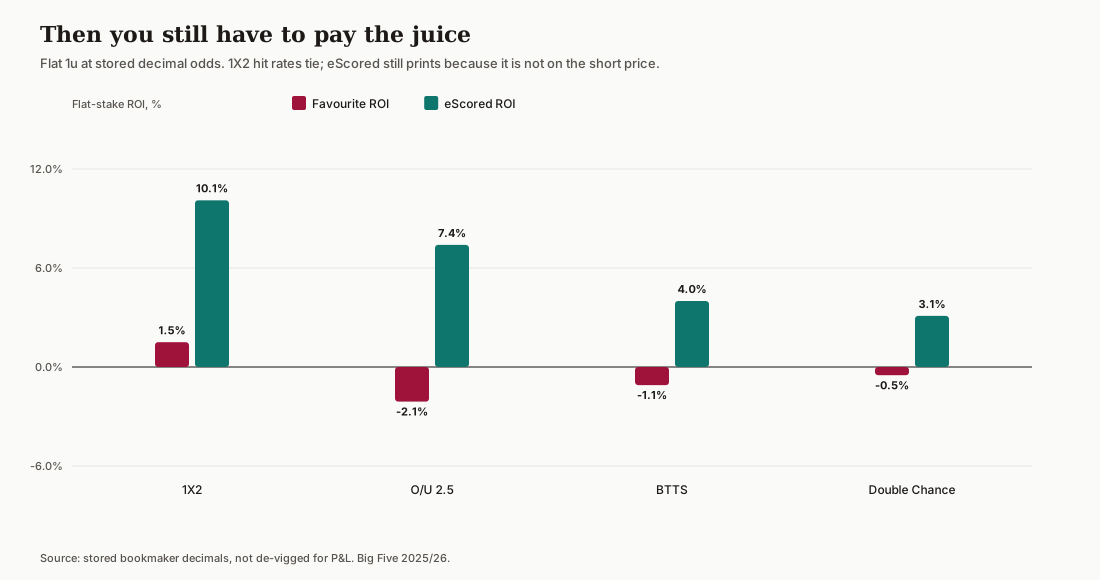
Over/Under is a side. The favourite hit 57.1% and still lost 2.1%. eScored’s extra hits cleared the juice: +7.4%.
1X2 is a price. Hit rates are the same number. eScored still prints +10.1% against +1.5% because the average stored odds on its pick are 2.24 against 2.01 on the favourite. It is not winning Home/Draw/Away as a classifier. It is not paying the short price when it disagrees.
BTTS is almost nothing on the hit. The +4.0% vs −1.1% is the same mechanism, smaller.
Double Chance still hits ~80%. The favourite barely covers the margin (−0.5%). eScored’s extra 0.8 pp is enough to print +3.1%. Hitting four times out of five and making 3% is the lesson from the companion markets piece, with a quieter ending.
Correct score is not in the argument. On 700 overlapping matches the two sides agreed 99% of the time. There is nothing to compare.
| Market | Disagreements | eScored right | Favourite right |
|---|---|---|---|
| Over/Under 2.5 | 398 | 213 | 185 |
| BTTS | 414 | 208 | 206 |
| 1X2 | 234 | 81 | 78 |
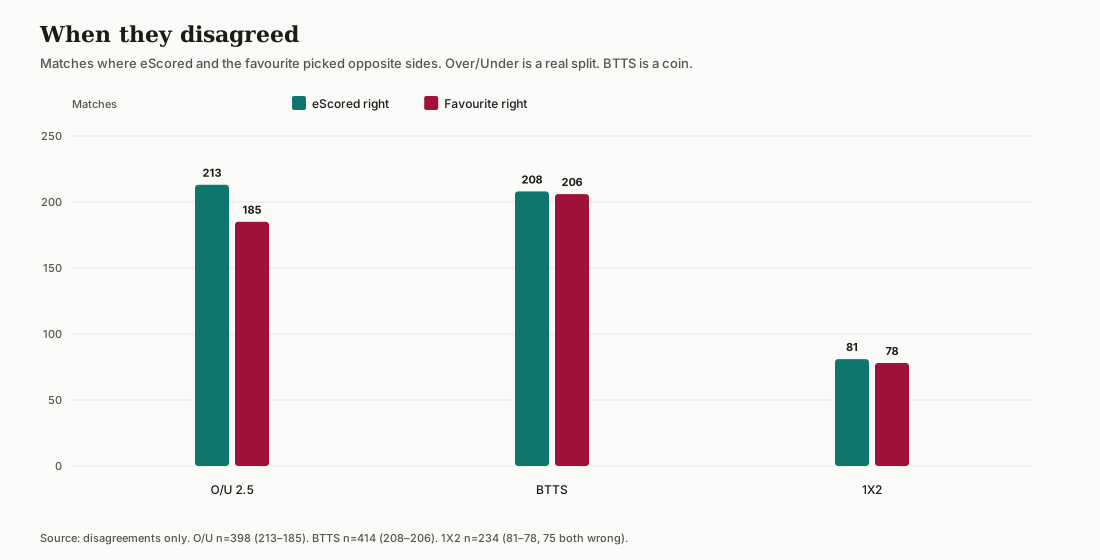
Over/Under is a real split. BTTS is a coin. 1X2 disagreement is small, and 75 of those 234 matches were both wrong. The 1X2 money is not coming from a pile of faded favourites. It is coming from a slightly longer number on a slightly different pick.
Over 2.5 is not one market. League base rates differ. The favourite is not a loser in every league. In Ligue 1 the short side paid. In Serie A it did not. eScored is fading that coupon — the same instinct as looking for mispriced teams, applied to a line.
| League | n | Fav hit / eScored hit | Fav ROI | eScored ROI | Disagree (model / mkt right) |
|---|---|---|---|---|---|
| Premier League | 297 | 55.9 / 55.9 | −1.3% | +3.1% | 43 / 43 |
| Bundesliga | 241 | 60.6 / 63.9 | −2.6% | +6.7% | 22 / 14 |
| Serie A | 310 | 50.3 / 53.5 | −11.3% | +0.8% | 54 / 44 |
| Ligue 1 | 232 | 61.2 / 63.8 | +7.1% | +17.9% | 42 / 36 |
| La Liga | 287 | 59.6 / 61.0 | 0.0% | +11.1% | 52 / 48 |
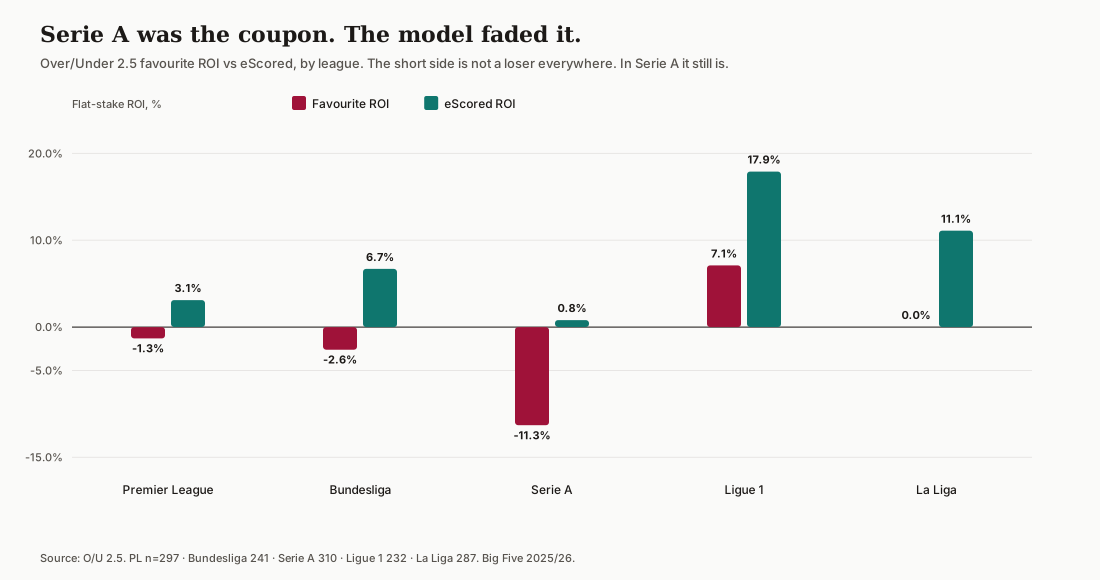
eScored is non-negative on Over/Under in every league. The favourite is not. Serie A is where a popular market can look “accurate” and still be the wrong side of the price.
BTTS by league is messier. Ligue 1 BTTS goes the other way (eScored −9.4% ROI). That is why the headline is Over/Under and 1X2, not “the model is better”.
eScored’s Over/Under pick sits at 60.7% average probability and hits 59.2%. The side is still right more often than the coupon. The number on the pick is no longer a cartoon.
The 1X2 pick is almost a postcard: 53.2% probability, 53.2% hit. That is why a 0.2 pp hit-rate edge can print +10% ROI.
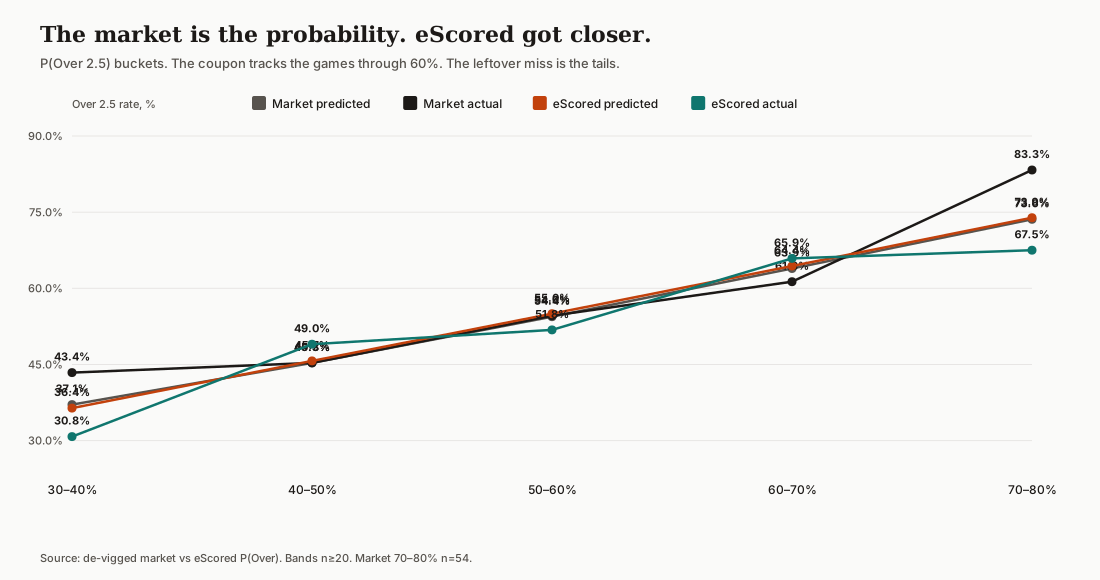
In the 60–70% Over band the model predicted 64.4% and the games produced 65.9%. The leftover miss is the tails: 30–40% (36.4 predicted, 30.8 actual) and 70–80% (73.9 vs 67.5). The stored market through 60% sits on the games.
Log loss on Over/Under is still slightly worse for eScored (0.699 vs 0.677) even as Brier improves. Closer is not the same as sharp in every band.
If you only keep cases where eScored’s probability sits at least 5 pp above the de-vigged price, Over/Under ROI on this sample rises to +22.3% (n=707). That cut was not how the picks above were chosen. It is not a published tip rule. Do not quote it as the result.
It is not live paper trading of Daily Tips. It is the model book against the stored favourite on finished Big Five league matches.
It is not one “accuracy %” for the website. Over/Under is a side. 1X2 is a price. Average them and you have a brochure.
It is not a licence to follow BTTS in Ligue 1. It is not a Double Chance miracle: 80% hit rate and 3% ROI is still juice with a small edge on top.
Football predictions are not guaranteed. Historical ROI is not a future return. eScored is a prediction and analytics platform, not a bookmaker.
Season 2025/26, Big Five round-robin only. Favourite = shortest de-vigged stored bookmaker price. eScored = model_source = XGBoost, argmax. ROI = flat 1u on the raw decimal. Expected goals from the model, markets from a Poisson score matrix.
Yes—but the most important result was not a higher hit rate. It was a better price.
On 1X2, eScored and the market favourite were right equally often: 53.2% versus 53.0%. Yet eScored returned +10.1% ROI against +1.5%, with average odds of 2.24 rather than 2.01. The model did not find substantially more winners. It identified when the market’s short-priced favourite was not worth paying and found the same number of winners at longer odds.
Same hit rate. Better price. That is the edge.
Over/Under 2.5 supports the conclusion from another direction: eScored both hit more often—59.2% versus 57.1%—and returned +7.4% while the market favourite lost 2.1%. BTTS and Double Chance showed smaller advantages and were less consistent across leagues.
Only if it beats the price. Double Chance favourites hit ~80% here and still made almost nothing. Compare hit rate, average odds, and ROI together — the same frame as the 2026 accuracy piece.
No. Best stored decimal in the Bookmaker snapshot copied onto the prediction row. Not a named bookmaker close, not Betfair SP.
No. Headline numbers are always-on argmax versus the favourite.
Not simply by predicting more winners. In this sample, eScored’s AI football prediction model beat the market favourite on Over/Under hit rate and ROI. On 1X2, the hit rates were almost identical, but eScored produced the higher return by selecting a longer price when the two sides disagreed. Historical outperformance does not guarantee future profit.
Yes—if it wins at better prices. eScored and the market favourite both hit approximately 53% of their 1X2 picks, but their flat-stake returns were +10.1% and +1.5% respectively. The difference came from price selection, not from predicting substantially more winners.
Responsible Gambling Disclaimer
eScored content is provided for informational and analytical purposes only and does not constitute financial advice or encouragement to gamble. Predictions and statistics do not guarantee winnings. Betting involves the risk of financial loss and is intended only for adults of legal gambling age. You are solely responsible for your decisions and any resulting consequences. Always follow the laws of your jurisdiction and gamble responsibly.
Select matches to build your Betslip
Two or more legs are from the same match. Multiplying probabilities overstates the chance — those outcomes share one score.
Unlock joint probability