Master Poisson Distribution: 3 Ways eScored Transforms Football Predictions and Betting Tip
Predicting football outcomes has long fascinated fans, analysts, and betting enthusiasts. While football remains inherently unpredictable, statistical models like the Poisson distribution provide a structured way to assess probabilities for match outcomes. At eScored, we harness the power of Poisson distribution to deliver accurate football predictions and insightful betting tips, offering our users an edge in understanding the beautiful game.
Table of Contents
What is the Poisson Distribution?
The Poisson distribution is a probability model used to estimate the likelihood of a certain number of events occurring within a fixed interval. These events must happen independently and at a constant average rate.
In the context of football, the events are goals scored by each team during a match. By analyzing historical data—such as team scoring rates, defensive records, and game conditions—we can calculate probabilities for specific scorelines or outcomes (win, draw, or loss).
The Poisson Formula
The formula to calculate the probability \( P(k; \lambda) \) of a team scoring \( k \) goals is:
\[ P(k; \lambda) = \frac{\lambda^k e^{-\lambda}}{k!} \]
Where:
- \( P(k; \lambda) \): Probability of scoring \( k \) goals.
- \( k \): Number of goals (a non-negative integer).
- \( \lambda \): Expected goals (xG) for the team.
- \( e \): Euler’s number (\( \approx 2.718 \)).
- \( k! \): Factorial of \( k \) (e.g., \( k! = 1 \times 2 \times 3 \dots \times k \), with \( 0! = 1 \)).
How It Works
By plugging in the expected goals (\( \lambda \)) for a team, we can estimate the probability distribution of all possible goal outcomes. For example:
If \( \lambda = 2 \), the formula will provide the probabilities for scoring 0 goals, 1 goal, 2 goals, and so on.
Example
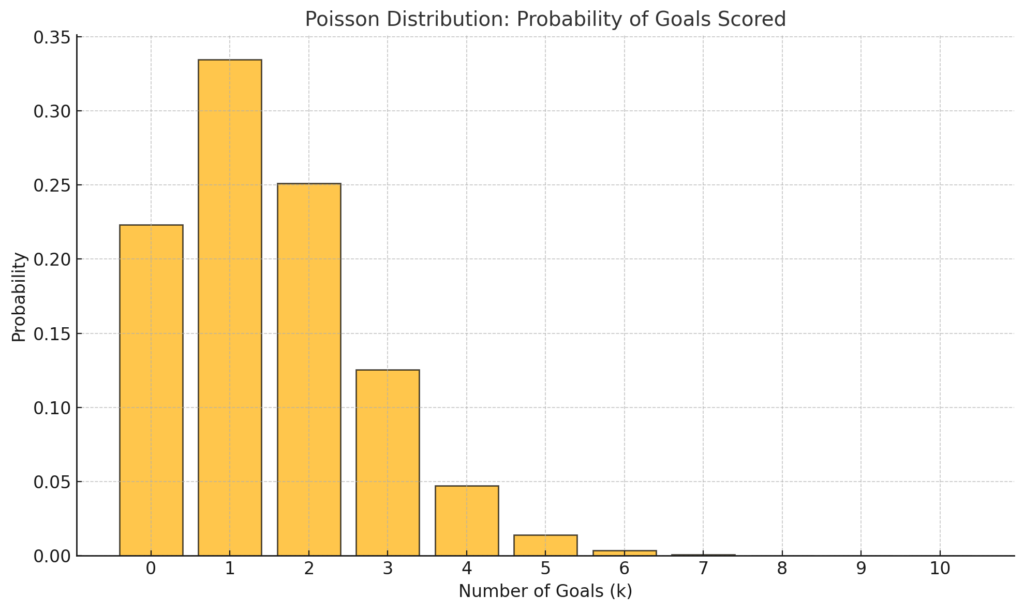
If a team’s expected goals (\( \lambda \)) is 1.5, the probability of scoring exactly 2 goals (\( k = 2 \)) is:
\[ P(2; 1.5) = \frac{1.5^2 \cdot e^{-1.5}}{2!} = \frac{2.25 \cdot 0.2231}{2} \approx 0.251 \]
Thus, there’s about a 25.1% chance the team scores exactly 2 goals.

How Poisson Distribution Works in Football Predictions
1. Calculating Expected Goals (xG):
Expected Goals (xG) represent the average number of goals a team is likely to score based on past performance and specific match conditions. Factors include:
- Average goals scored per game by Team A
- Average goals conceded per game by Team B
- Adjustments for home/away advantage
For example:
- Team A scores an average of 2.0 goals per game and concedes 1.2.
- Team B scores 1.5 goals per game and concedes 1.8.
We calculate the xG values:
- Team A’s xG against Team B = (2.0 + 1.8) / 2 = 1.9
- Team B’s xG against Team A = (1.5 + 1.2) / 2 = 1.35
2. Applying the Poisson Model:
Using these xG values (), the Poisson formula calculates probabilities for different scorelines. For example:
- Probability of Team A scoring 0, 1, 2, or more goals.
- Probability of Team B scoring 0, 1, 2, or more goals.
3. Simulating Match Outcomes:
The probabilities for each team’s scoreline are combined to simulate match results:
- Team A Win: Combine probabilities where Team A scores more than Team B.
- Draw: Combine probabilities where both teams score the same number of goals.
- Team B Win: Combine probabilities where Team B scores more than Team A.
This creates a comprehensive probability table for the match, including exact scoreline predictions and outcome likelihoods.
How eScored Uses Poisson Distribution
At eScored, we integrate the Poisson distribution into our prediction algorithms to provide detailed insights for both football fans and bettors. Here’s how we utilize it:
1. Accurate Score Predictions:
Our platform uses historical data from leagues worldwide to calculate xG values for every match. By applying the Poisson model, we generate probabilities for exact scorelines, helping users understand the most likely outcomes.
2. Win/Draw/Loss Probabilities:
We present users with clear percentages for a team’s chances of winning, drawing, or losing a match. This information is especially valuable for betting enthusiasts who want to weigh risks and rewards.
3. Betting Tips:
Using the scoreline probabilities, we craft actionable betting tips, such as:
- Over/Under Goals Markets: Based on the likelihood of high or low-scoring matches.
- Both Teams to Score (BTTS): By analyzing defensive and attacking strengths.
- Correct Score Bets: For more ambitious betting strategies.
4. Dynamic Updates:
Our system dynamically updates predictions to reflect:
- Injuries or suspensions
- Changes in form
- Weather conditions and other external factors
Real-World Example: Using Poisson for a Premier League Match
Let’s analyze a hypothetical Premier League match between Manchester City and Liverpool:
- Historical Data:
- Manchester City’s average goals scored per game: 2.8
- Liverpool’s average goals conceded per game: 1.4
- Liverpool’s average goals scored per game: 2.2
- Manchester City’s average goals conceded per game: 0.9
- Expected Goals (xG):
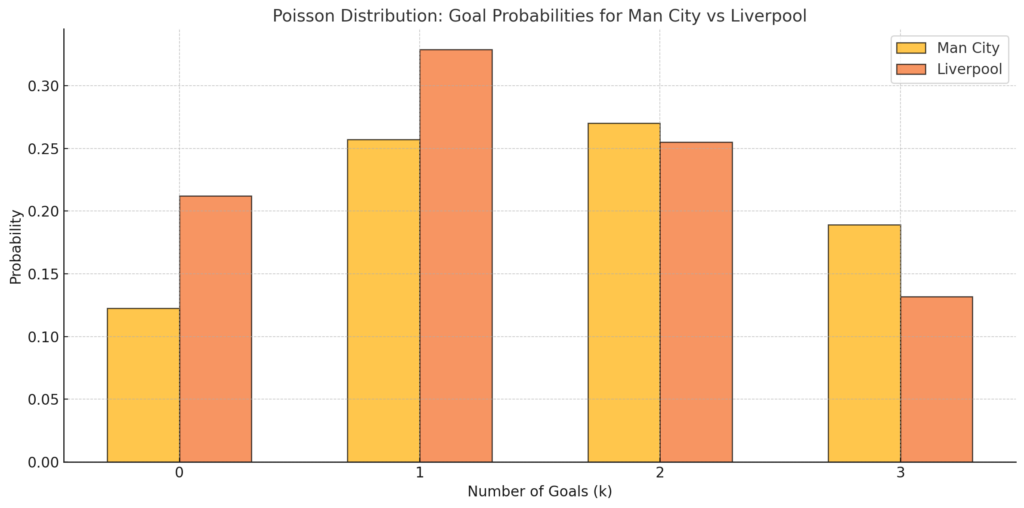
- Man City’s xG = (2.8 + 1.4) / 2 = 2.1
- Liverpool’s xG = (2.2 + 0.9) / 2 = 1.55
- Scoreline Probabilities: Using the Poisson formula, we calculate the probability of each scoreline:
- Probability of Man City scoring 0, 1, 2, 3 goals.
- Probability of Liverpool scoring 0, 1, 2, 3 goals.
- Outcome Predictions:
- Manchester City Win: 52%
- Draw: 23%
- Liverpool Win: 25%
- Betting Tips:
- Likely scoreline: 2-1 to Manchester City.
- Recommended bets: Manchester City win or Over 2.5 goals.

Limitations and Enhancements
While Poisson distribution is a powerful tool, it has limitations:
- Independence Assumption: Goals are not always independent; tactical changes or momentum shifts can influence outcomes.
- Excludes Rare Events: Red cards, penalties, and injuries can significantly affect results but are not modeled.
- Static Nature: Does not adapt well to real-time changes during a match.
At eScored, we mitigate these limitations by:
- Incorporating advanced metrics like shot quality, possession stats, and defensive errors.
- Using machine learning models to complement Poisson-based predictions.
- Regularly updating our algorithms with the latest match data.
Conclusion
The Poisson distribution is a cornerstone of football predictions, offering a mathematical approach to understanding match outcomes. At eScored, we leverage this model to provide users with accurate predictions and actionable betting tips, combining data science with the passion of football.
Whether you’re a seasoned bettor or a curious fan, our platform empowers you with the insights needed to make informed decisions and enjoy the game like never before. Explore our tools and predictions today, and see how data-driven analysis can transform your football experience!


